INTRODUCTION TO POPULATION GENETICS
In this and the next few lectures we will be dealing
with population genetics which generally views evolution as changes
in the genetic makeup of populations. This is a somewhat reductionist approach:
if we could understand the combined action of the forces that change gene
frequencies in populations, and then let this run over many generations
we might understand long term trends in evolution. Continuing debate: can
the processes of microevolution account for the patterns of macroevolution?
Population genetics is an elegant set of mathematical models developed
by largely by R. A. Fisher and J. B. S. Haldane in England and Sewall Wright
in the US. Continues to be developed by many mathematical, theoretical
and experimental biologists today (see J. Crow and M. Kimura Introduction
to Population Genetics Theory).
In very simple terms, population genetics involves
analyses of the interactions between predictable, "deterministic"
evolutionary forces and unpredictable, random, "stochastic" forces.
The deterministic forces are often referred to as "linear pressures"
because they tend to push allele frequencies in one direction (up, down
or towards the middle). Important forces of this nature are selection,
mutation, gene flow, meiotic drive (unequal transmission of certain
alleles [a form of selection]), nonrandom mating (also a form of
selection). The primary stochastic evolutionary force is genetic drift
which is due to the random sampling of individuals (and genes) in small
populations. It is important to realize that the deterministic forces may
act together or against one another (e.g., selection may "try"
to eliminate an allele that is pushed into the population by recurrent
mutation). Moreover, deterministic forces may act with or against genetic
drift, to determine the frequencies of alleles and genotypes in populations
(e.g., gene flow tends to homogenize different populations while drift
tends to make them different). Hence, the interaction of these forces is
what we are really interested in (a later lecture), but since this can
get very complex mathematically, we will start by analyzing one force at
a time.
To begin we need to understand some simple population
genetic "bookkeeping." Consider a locus with two alleles
(alternative forms of the DNA sequence that "reside" at that
locus, e.g., one from mother other from father). Now consider a population
of N individuals (N=population size); this means that there are
2N alleles in the population. We can thus talk about genotype
frequencies and allele frequencies. In a population of N = 100
individuals, if there are 25 AA, 50 Aa and 25 aa, then the genotype frequencies
are f(AA) = 0.25, f(Aa) = 0.50 and f(aa) = 0.25. If we count up the individual
alleles there are 200 of them (because there are 100 diploid individuals).
Hence to determine the frequency of the "A" allele we have to
count each individual "A" allele that is specified in each diploid
genotype. We get f(A) = (25+25+50) / 200 = 0.5. We generally refer to the
frequency of the "A" allele as f(A) = p; the frequency of the
"a" allele is f(a) = q. Note that p = (1-q) because the sum of
the allele frequencies must be 1.0. Common "language errors"
in learning population genetics are to refer to the "p" allele
when you really mean the "A" allele, or to say "the frequency
of the p allele" when you really mean: "...p, the frequency of
the "A" allele..." Got it?? Good.
Since evolution is change in the genetic makeup of
a population over time, a general approach to modeling this is to determine
the allele and genotype frequencies in the next generation (pt+1)
that result from the action of a force on those frequencies in the current
generation (pt). Thus :
pt -> evolution happens
-> pt+1
Consider a simplistic life cycle where the
genotypes (a single locus way of referring to adults) produce gametes.
These gametes mate to form new genotypes (=adults). See 5.1, pg.
93 and 5.3, pg. 99. The relationship between allele frequencies (sometimes
called "gene" frequencies) and genotype frequencies is determined
by the Hardy Weinberg Theorem which defines the probabilities by
which gametes will join to produce genotypes. Consider a coin toss: probability
of a head = 0.5; of a tail = 0.5; prob. of two heads = 0.5x0.5 = 0.25;
prob. of one head and one tail = 0.5x0.5 = 0.25, etc. Each coin is analogous
to the type of allele you can get from one of your diploid parents; the
tossing of two coins is analogous to the mating of two individuals to produce
four possible genotypes (but heads,tails is the same as tails,heads). Now
consider a roll of the dice. The probability of each face is 1/6, and is
actually analogous to cases where more than two different alleles exist
in the population at a given locus. The probability of any combination
is 1/6 x 1/6 = 1/36. But recall that there can be more than one way to
get many of the combinations (2,3 is the same as 3,2). The general expression
for the number of genotypes that can be assembled from n different alleles
is: [n(n+1)/2].
Assumptions of Hardy Weinberg: 1) diploid
sexual population 2) infinite size, 3) random mating, 4)
no selection, migration or mutation. This is a Null Model; obviously
some of these assumptions will not hold in real biological situations.
The theorem is useful for comparison to real-world situations where deviations
from expectation may point to the action of certain evolutionary forces
(e.g., mutation selection, genetic drift, nonrandom mating, etc.). Use
a Punnet square to determine genotype frequencies: f(AA) = p2,
f(Aa) = 2pq, f(aa) = q2 and p2
+ 2pq + q2 = 1 Learn this: One generation of random
mating restores Hardy Weinberg equilibrium. H-W equilibrium
is when the genotype frequencies are in the proportions expected based
on the allele frequencies as determined by the relation p2 +
2pq + q2. This is derived more thoroughly in table 5.1, and
accompanying text, pg. 94.
Example: consider a sample of 100 individuals with the following genotype frequencies:
|
Observed Genotype Frequencies |
Allele count |
Allele frequency |
Expected genotytpe frequencies under H-W |
|
| BB | 0.71 | 142 B | p = 156/200 = 0.78 | p2 = (.78)2 = 0.61 |
| Bb | 0.14 | 14 B, 14 b | 2pq = 2(.78)(.22) = 0.34 | |
| bb | 0.15 | 30 b | q = 44/200 = 0.22 | q2 = (.22)2 = 0.05 |
Observed are different from expected, thus some force
must be at work to change frequencies.
NATURAL SELECTION
Selection occurs because different genotypes
exhibit differential survivorship and/or reproduction. If we consider a
continuously distributed trait (e.g., wing length, weight) with a strong
genetic basis, the response to selection can be characterized by where
in the distribution the "most fit" (greatest survivorship&reproduction)
individuals lie. If after selection one extreme is most fit this
is directional selection; if the intermediate phenotypes
are the most fit this is stabilizing selection; if both extremes
are the most fit this is disruptive selection.
R. A. Fisher proposed a simple bookkeeping, or population genetics, approach for one locus with two alleles: we have AA, Aa and aa in frequencies p2, 2pq, q2 . Define lii as the genotype-specific probability of survivorship, mii as the genotype-specific fecundity. We build a model that will predict the frequencies of alleles that will be put into the gamete pool given some starting frequencies at the preceding zygote stage;
| Genotypes | Zygote | -----> -----> | Adult | -----> -----> | Gametes |
| AA | p2 | lAA p2 | mAA lAA p2 | ||
| Aa | 2pq | lAa 2pq | mAa lAa 2pq | ||
| aa | q2 | laa q2 | maa laa q2 |
The gamete column is what determines the frequencies of A and a that will be put into the gamete pool for mating to build the next generation's genotypes. We can simplify by referring to the fitness of a genotype as wii = mii lii . These fitness values will determine the contribution of that genotype to the next generation. Thus the frequency of A allele in the next generation pt+1 (sometimes referred to as p') would be the contributions from those genotypes carrying the A allele divided by all alleles contributed by all genotypes:
pt+1 = (wAA p2 + wAa pq)/(wAA p2 + wAa 2pq + waa q2). Or for the a allele,
qt+1 = (waa q2 + wAa pq)/(wAA p2 + wAa 2pq + waa q2). Note that the heterozygotes are not 2pq but pq because in each case they are only being considered for the one allele in question. If we scale all wii's such that the largest = 1.0 we refer to these as the relative fitnesses of the genotypes. A worked example where p = .4, q = .6 and wAA = 1.0 wAa = 0.8 waa = 0.6:
Genotype frequencies are p2 = 0.16, 2pq = 0.48, q2 =0.36, thus:
pt+1 = ((.16 x 1.0) + (.24 x .8))/((.16
x 1.0) + (.48 x .8) + (.36 x .6)) = .463; so q = .537 and thus f(AA)t+1
= .215, f(Aa)t+1 = .497 and f(aa)t+1 = .288. Note
both allele frequencies and genotype frequencies have changed (compare
to what we saw with inbreeding). This can be continued with the new allele
frequencies and so on. When will the selection process stop? when Dp
= 0, i.e., when pt+1 = pt . In some situations this
will stop only when one allele is selected out of the population (p = 1.0).
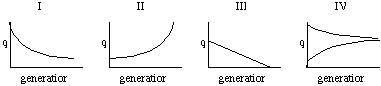
Now we can consider various regimes of selection (s = selection coefficient, (1-s) is fitness):
| AA | Aa | aa | ||
| I | 1 | 1 | 1 - s | selection against recessive |
| II | 1 - s | 1 - s | 1 | selection against dominant |
| III | 1 | 1 - hs | 1 - s | incomplete dominance (0<h<1) |
| IV | 1 - s | 1 | 1 - t | selection for heterozygotes |
Substitute the fitnesses (wii) in condition I above into the expression Dp = pt+1 - pt and prove for yourself that the equations on page 101 (eqn. 5.5) is related to the expression for pt+1 shown above. First three are directional in that selection stops only when allele is eliminated. In I the elimination process slows down because as q becomes small the a alleles are usually in heterozygote state and there is no phenotypic variance. In II selection is slow at first because with q small most genotypes are AA so there is low phenotypic variance; as selection eliminates A alleles q increases and the frequency of the favored genotype (aa) increases so selection accelerates. III is like the worked example run to fixation/loss. IV is known as balancing selection due to overdominance (heterozygotes are "more" than either homozygote). Both alleles maintained in population by selection. This is an example of a polymorphic equilibrium (fixation/loss is also an equilibrium condition but it is not polymorphic). The frequencies of the alleles at equilibrium will be:
pequil = t/(s + t); qequil = s/(s+t).
Classic example = sickle cell anemia. A=normal
allele; S=sickle allele. S should be eliminated because sickle cell anemia
lowers fitness. S is maintained where malarial agent (Plasmodium falciparum)
exists because AS heterozygotes are resistant to malaria. Note that S allele
is very low frequency where there is no malaria (the selective coefficient
of S is different because the environment is different). See figure
5.8, pg. 120; table 5.9, pg. 119.
Another way that genetic variation can be maintained is through multiple niche polymorphism (polymorphism maintained by environmental heterogeneity in selection coefficients). If different genotypes are favored in different niches, patches or habitats, both alleles can be maintained.
| AA | Aa | aa | |
| habitat 1 | 1.0 | 0.8 | 0.5 |
| habitat 2 | 0.5 | 0.8 | 1.0 |
Heterozygotes will have the highest average
fitness although they are not the most fit in either habitat (see figure
5.12, pg. 124). The same dynamics would apply to temporal heterogeneity
(spring and fall; winter and summer) assuming that selection did not eliminate
one allele during the first period of selection. Classic example of temporal
heterogeneity: third chromosome inversions of Drosophila pseudoobscura
studied by T. Dobzhansky. Different chromosomal arrangements ("Standard"
and "Chiricahua") show reciprocal frequency changes during the
year.
Yet another way to maintain variation by selection is through frequency dependent selection.
If an allele's fitness is not constant but increases
as it gets rare this will drive the allele back to higher frequency. See
figure 5.9, pg. 121. Example: allele may give a new or distinct phenotype
that predators ignore because they search for food using a "search
image" (e.g., I like the green ones).
Most (by no means all) evolutionary biologists believe
that selection plays a major role in shaping organic diversity, but it
is often difficult to "see" selection. One reason is that selection
coefficients can be quite small (1-s ~1) so the response to selection is
small. When selection coefficients are large Dp
can be large, but the problem here is that with directional selection fixation
is reached in a few generations and we still can't "see" selection
unless we are lucky enough to catch a population in the middle of the period
of rapid change.
What affects the rate of change under selection? Recall that Dp = pt+1 - pt
Dp = [(wAA
p2 + wAa pq)/(wAA p2 + wAa 2pq + waa
q2)] - p . With some simple algebra we can rearrange this
equation to: Dp
= (pq[p(wAA - wAa) + q(wAa - waa)])/(wAA
p2 + wAa 2pq + waa q2)
Note that Dp
will be proportional to the value of pq. This value (pq) will be largest
when p=q=0.5 or, in English, when the variance in allele frequency
is greatest. This is a simplified version of the main point of the fundamental
theorem of natural selection modestly presented by R. A. Fisher.
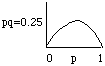
It states that the rate of evolution is proportional to the genetic variance of the population. In the above example we have not explicitly defined the fitnesses wiis or the dominance relationships and these can have a major effect on Dp as written above.
Another important observation for looking at this
Dp equation and plugging
in some values is that selection always increases the mean fitness of
the population. For example with p=0.4, q=0.6 and wAA=1,
wAa=0.8 and waa=0.6, the mean fitness (w'bar') =
0.76. After one generation of selection p' = 0.463 and q' = 0.537. Recalculating
w'bar' we get wbart+1 = 0.78, which is greater than 0.76. When
will this process stop? At fixation (or equilibrium with overdominance).
This treatment of the algebra of natural selection illustrates what selection alone can do to allele and genotype frequencies. In the next lectures we will consider other evolutionary forces (mutation gene flow, genetic drift), how they act alone, and eventually, how they interact with each of the other evolutionary forces.