
Biology 48 Evolutionary Biology
Final Exam May 13, 1996
Name ___________________ ID #______________
INSTRUCTIONS: 1. Think before you write.
2. Write short, concise answers.
Lengthy answers will be selected against
Some formulas:
pt+1 = (pt2wAA + ptqtwAa)/(pt2wAA+2ptqtwAa+qt2waa)
pequil = t/(s+t)
pequil = v/(u+v)
pt+1= pt(1-u)+qt(v)
p2 + 2pq + q2 = 1
1/Ne = (1/t) (·1/Ne)
Ne = (4NmNf)/(Nm+Nf)
ppop1 t+1 = ppopl t (1-m) + ppop2 t (m)
random variance in p = (pq/2N)0.5
y = bxa
log y = log b + a log x
1. Clearly define and state the significance of each of the following terms. (4 points each ·= 20)
Endemic species
Genetic hitchhiking
Species selection
Linear pressures
Mosaic evolution
2. Clearly distinguish between each of the following pairs of terms.
(6 points each; ·= 38)
Exaptation / Adaptation
Semelparity / Iteroparity
Isolation / Recognition concepts
3) If one looks at any lineage of organisms through evolutionary time
(e.g., horses, hominoids), it is difficult to avoid the conclusion that
evolution has lead to "progress" from "primitive" to
"advanced." However, it is often stated that natural selection
is "myopic" (short sighted). What is meant by this latter term,
and how does it relate to the issue of progress in evolution. Be brief
and clear! (10 points; ·= 48)
4) In the paper by Gould and Lewontin, they use the concept of the Spandrel
to illustrate a very specific point in evolutionary biology. i) What is
a Spandrel? ii) How does it bear on our thinking of organisms and their
constituent parts, and iii) Clearly explain whether and how
their point was supportive or critical of the adaptationist program?
(15 points; ·= 63)
5) You obtain a genetic distance between two species of flies endemic to the island of Kauai that are known to be each other's closest relative. Based on reliable molecular clock estimates these two species diverged from each other 15 million years ago. How can you account for this observation given that Kauai is only 5 million years old? (12 points; ·= 75)
6) On Mars, there are paternal social groups in which one "king"
male mates with all the females in his harem. On Venus, there are maternal
social groups in which one "Queen" female mates with all the
males in her harem. On both Mars and Venus social groups are comprised
of one "alpha" male or female, respectively, and 100 harem members
of the other sex. What is the effective population size for maternally
inherited mitochondrial DNA, autosomal DNA and male inherited Y-chromosome
DNA in a representative harem on Mars and Venus? Show and briefly explain
your work for each planet separately. Hint: autosomal DNA is diploid
and passed on by both sexes; mtDNA and Y DNA is haploid and
passed on by one sex (15 points; ·=
90)
7) In most organisms studied to date, the rate of recombination varies across the genome. For example, recombination is reduced near centromeres (where spindle fibers attach) and occurs at "normal" rates in the middle of chromosome arms. The figure below shows a positive relationship between the amount of recombination occurring in the region surrounding a locus and the amount of DNA variation observed at that locus in Drosophila melanogaster. The data were obtained from published rates of recombination near each gene (X-axis) and from studies of DNA sequence variation (Y-axis; each data point represents a different locus and contains the following data: 50 DNA sequences 1000 bases long were obtained, aligned and mutations were counted in the 50 sequences; the number of changes was divided by 1000 to give variation per base pair). Recognizing that mutations can be deleterious, neutral or advantageous, why should genes lying in regions of low recombination (i.e., infrequent or distantly spaced cross-overs) exhibit little DNA polymorphism? You can assume that recombination does not increase the mutation rate (10 points; ·= 100)

8) The size of pink salmon fished from the Pacific Northwest decreased noticeably from 1951 -1974, as illustrated in the plot below. This directional selection has been attributed to the use of gill nets that catch predominantly larger fish. The slope of the line in the plot below is -0.1, with units of pounds per generation (2 years per generation) and indicates the change resulting from selection. From estimates of the average size of salmon caught in gill nets, the average size of salmon in the population as a whole (i.e., before being fished) and the proportion of the population that is caught in nets, it has been determined that salmon who survive to spawn (i.e., the post fishing population) are 0.4 pounds smaller than the population average, which indicates the strength of selection imposed on the population. Based on this information, and your extensive knowledge of quantitative genetics, i) what is the heritability for body size in pink salmon?, and ii) is this likely to be greater, the same or smaller than the heritability for body size before fishing began, and iii) why might the two estimates differ? (15 points; ·= 115)

9) Coyne and Orr found a positive relationship between genetic distance
and the degree of prezygotic isolation between pairs of species of Drosophila.
Below are two figures that illustrate this relationship for pairs of species
that are allopatric or sympatric with respect to one another. i) What is
the important difference between these two plots and ii) provide a clear
explanation for this difference (20 points; ·=
135)
10) Below is a graph that depicts the evolution of mitochondrial DNA. Answer the following questions in one sentence per question: i) how would you obtain the primary data to construct this graph (i.e., what information do you need in order to place each data point on the graph)? ii) how does one account for the leveling-off of the curve, iii) for what range of divergence times would mitochondrial DNA be the most informative and reliable molecular clock, and why? (15 points; ·= 150)

11) On the blank graph below, clearly label the axes and provide data
points that illustrate the primary observation that lead Van Valen to propose
the Red Queen hypothesis. Briefly describe the major points and significance
of this hypothesis. (15 points; ·= 165)

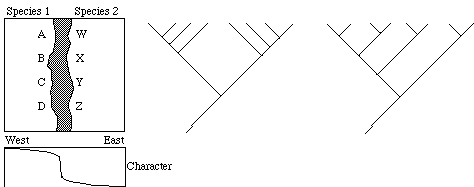
12) The figure below depicts an area where two differentiated "species" hybridize in a narrow band of overlap (gray area). Two very different models of speciation can be invoked to explain the origin of this zone of hybridization, both of which could produce very similar patterns of geographic variation in characters (see graph below map). One way to distinguish between these two models is to take a molecular phylogenetic approach. For example, you have obtained DNA sequence data from a random, neutral segment of nuclear DNA from one individual each from collecting localities A, B, C, D and W, X, Y, Z all of which lie outside the zone of hybridization. Assuming that the sequences you obtained from this approach reveal phylogenetically informative nucleotide changes, two general phylogenies (i.e., "gene trees") can be envisioned that would support the two distinct models of speciation. Examples of these trees are depicted on the right. For each tree, i) identify the model of speciation that best applies, ii) label each terminal branch with a letter that corresponds to one of the eight collecting localities, and iii) clearly explain why each tree pattern supports one model and not the other. (15 points; ·= 180)
13) i) Draw and clearly label all axes of an adaptive landscape.
ii) Describe the three important phases of the shifting balance
theory of evolution proposed by Sewall Wright. iii) Describe the population
structure of two different species in which shifting balance is likely
to be important and unimportant, respectively. Answers should
contain no more than i) a small drawing, ii) three short phrases and iii)
one short sentence. (20 points; ·= 200)
Extra questions:
12) You have just discovered a new species of beetle that is polymorphic for the number of spots on its wings. From a variety of studies you determine that this beetle is diploid, that in the species as a whole there are exactly two alleles at all loci and that the alleles are additive both within loci and between loci in their contribution to phenotype (i.e., no dominance, epistasis or pleitropy). Below is a distribution of the number of beetles observed with anywhere from 1 to 7 wing spots in a large collection of beetles (e.g., beetles with 1 or 7 wing spots are the rarest and beetles with 4 wing spots are the most frequent). How many loci control spot number in this beetle? Justify your answer clearly and concisely. (10 points)

8) A sociology professor has hypothesized that wearing baseball hats
follows the dynamics of a single locus with two alleles. Out of 5000 undergraduates
sampled the professor observed the following phenotypic classes: 2 students
not wearing a baseball hat, 196 students wearing baseball hats with the
visor pointing forward and 4802 students wearing baseball hats with the
visor pointing backwards. Using your expertise in population genetics
clearly show why you agree or disagree with the hypothesis. (12 points)