QUANTITATIVE GENETICS
Quantitative genetics deals with the genetics of continuously varying
characters. Rather than considering changes in the frequencies of specific
alleles of genotypes, quantitative genetics seeks to "quantify"
changes in the frequency distribution of traits that cannot easily
be placed in discrete phenotypic classes. The reason for the continuous
variation is usually that the traits are polygenic (controlled by
many genes) and there are environmental effects that alter the phenotypic
state of each individual (see figures 9.3, 9.4, pgs. 226-227).
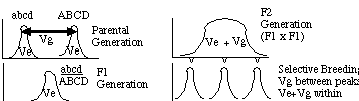
Consider two inbred strains that represent "extremes" of a
phenotypic distribution: high and low oil content in corn
for example or long and short carrots. We will assume that
the plants of each type are homozygous at all loci. Under this assumption
the variation we see within each group is entirely environmental
variation and the variation we see between the two groups is
mostly (but not entirely) genetic variation. If we then cross an
individual from the high group (ABCD) with an individual from the low group
(abcd) we would get F1 hybrids (ABCD/abcd) that are
intermediate in phenotype. We would notice that each individual is not
identical in phenotype even though each is identical in genotype (all F1's).
We would then attribute all the variation in phenotype to an environmental
component, VE. If we than crossed all the F1's
with each other, we would get an F2 distribution that would have a wider
distribution. Because of independent assortment of chromosomes and recombination
in the F1's each F2 is likely to have a unique multilocus genotype. Thus
the total phenotypic variance in the F2 distribution will have both
a genetic component, VG and an environmental
component (VE). In simple terms, these are related
by the expression VP = VG
+ VE.
If you were given a bunch of plants with a smooth continuous distribution
of phenotypes, how would you determine if there was a genetic basis to
the variation? Simply select individuals from the distribution with distinct
phenotypes, breed them (=parents) and compare the phenotypes of these parents
to that of their offspring. If the mean phenotype of offspring was close
to the mean of the parents this would be evidence for a genetic basis for
the phenotype and the trait would be identified as heritable. If
on the other hand, the offspring produced from two "high" parents
were extremely variable in phenotype and offspring produced from two "low"
parents were extremely variable there would be a weak genetic component
to the trait. The heritability in a "broad" sense can
be expressed as the proportion of the total phenotypic variance that has
a genetic component: h2B = VG/VP.
(see figures 9.5 pg. 231; 9.6 pg. 237).
This correlation between parent and offspring can serve as a
simple means of quantifying the heritability of the trait: if there is
a 1:1 correlation of phenotype between parents and offspring (e.g., a 45
degree slope of the regression of offspring phenotype vs. parent phenotype)
then the trait has the maximal heritability. With no relation between parents
and offspring (a slope of zero) the heritability would be zero (see box
9.1 pg. 233).
The genetic component of the variation can be broken up into different
subcomponents. Consider a simple additive model of beak size where the
number of B alleles you have determines the size of your beak: BB = 3cm,
Bb = 2cm and bb = 1cm. The mean of these phenotypes is 2cm; if you subtract
this mean from each of the three phenotypes you get 1cm, 0cm and -1cm as
the difference. These values describe the additive effect of replacing
one b allele with one B allele. A single B allele has one half the effect
of two B alleles, so our additive effect, a = 1. If we cross a BB
x bb we would get Bb with a beak size of 2cm. Crosses between these F1s
would result in a 1:2:1 ratio of 3cm:2cm:1cm beaks and the mean of the
F2's (2) would be the same as the mean of the F1's and the mean
of the two parents.
Now consider that BB and Bb have the same phenotype (i.e., there is
dominance): BB = 3cm, Bb = 3cm and bb = 1cm. A cross between BB and bb
would produce Bb F1's all with 3cm beaks. An F1 cross Bb x Bb would produce
F2's with a 3:1 ratio of 3cm:1cm. In these the mean of the two parents
would be 2, the mean of the F1's would be 3 and the mean of the F2s would
be 2.5. Thus, dominance would affect the variation in phenotypes.
There is a dominance component to the variance. Thus the genetic
variance can be partitioned into additive and dominance components (and
an interaction component which we will ignore, thank you): VG
= VA+VD+VI.
The total phenotypic variance is thus partitioned : VP = VA+ VD + VI + VE. The point of this is that we want to know the additive genetic component of the total phenotypic variance since this is what makes parent and offspring look alike and is what selection can act upon. We can thus refine our description of heritability to mean the proportion of the total phenotypic variance that is due to additive genetic effects: h2N = VA/VP where h2N means heritability in the "narrow" sense.
Returning to our regression of offspring values vs. parent values (see figure 9.4 page 227), the slope of this regression = h2N = VA/VP ( known as a midparent-offspring regression). This allows us to define what kind of response to selection we would get if we imposed a specific intensity of selection on a phenotypic trait. The selection differential (S) is the difference between the mean of the parents selected to produce the next generation and the mean of all individuals in the population. The response to selection (R) is the change in the mean phenotype after selection. The response to selection depends of the heritability of the trait:
R = h2N S (see figure 9.6 pg.
237).
An important consequence of this is that as selection proceeds, the
additive genetic variation will be reduced ("low" alleles removed).
As the VA decreases, the heritability decreases (see
equation for heritability above). Will selection come to a halt?? Probably
not because mutation is constantly introducing a trickle of new alleles
each with different additive effects. Under this view the gradual changes
in phenotype seen over long evolutionary times might be explained by a
continual mutation-selection balance. (see box 9.2 pg. 248).
What are the heritabilities of various traits in nature? They vary a
lot (see figure 9.13, pg. 245). One trend is that fitness-related
traits tend to have lower heritabilities than other traits. Why? In natural
populations fitnesses determine our "selection differentials"
so selection should remove genetic variation for fitness traits and heritabilities
will drop. Why then are not the heritabilities of fitness related traits
zero???? One answer: genetic correlations.
Due to the linkage of genes along chromosomes (or epistatic interactions among genes) selection of one trait can lead to selection for another trait. If a viability gene is linked between genes for bristle number, selection for high bristle number could lead to low viability if the low viability allele became associated with the high oil content alleles. If this were the case, there would b a negative genetic correlation between bristle number and viability. As it turns out, many fitness related traits have negative genetic correlations (e.g., size of eggs negatively correlated with number of eggs). Thus if fitness determines selection differential, selection in natural populations could not remove all the additive genetic variation for two fitness traits that are negatively correlated.